System Documentation


![]()
![]()
![]()
![]()
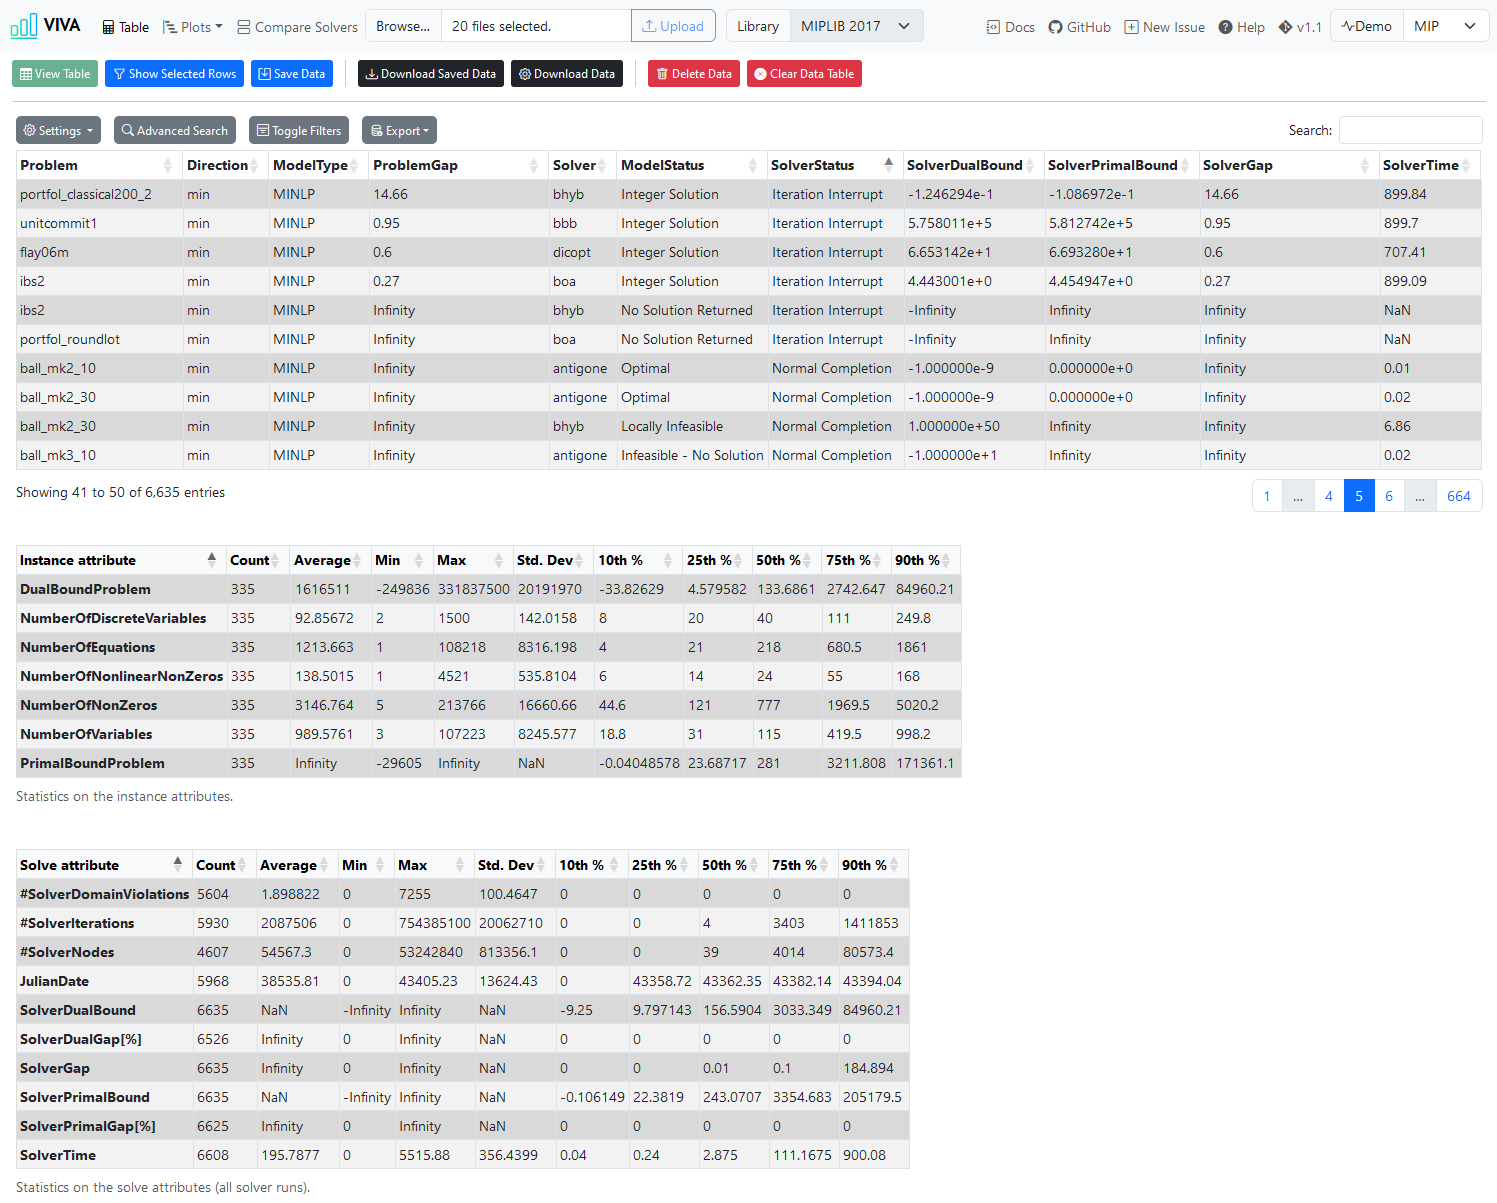
VIVA: Visualize, Interact, Verify, and Analyze Benchmarking Data for Optimization Solvers
Building on the concept and implementation of PAVER 2.0, the main goal of this project is to allow end users to interact with their own uploaded benchmark data from mathematical optimization problems and their solvers. The data is presented in a tabular format, with the added ability to visualize specific results through various plots, making it easier to understand and interpret the data. Demo-data is attained from miplib2010 examples. The .solu file data from the problem libraries MINLPLib, MIPLIB 2017 and MIPLIB 2010 can be accessed directly through a dropdown option in the navigation menu.
This project is developed using TypeScript, DataTables.js, Chart.js and Webpack. Bootstrap is used for styling. Notably, the application can be run without a live server since Webpack is responsible for bundling the files. It is also possible to install it as a Progressive Web Application by launching the project in a live server, navigating to the report page using a compatible browser, and installing it. Support for offline functionality is incldued in the PWA implementation.
TODO:
- Investigate support for trace files generated by Examiner.
- Remake file parsing.
- Remake user configuration structure.
- Investigate more PWA functionality.
1. Instructions for Using the Application
- To get started with the project, either download or clone the repository and open the
report.htmlfile in a web browser. - Click the "Browse" button to upload the results and select either:
- one or more results file in a
.trcformat..solu(best known primal and dual bounds for each instance) and.csv(instance properties) can be uploaded in conjugation to get additional information.
- or a single
UserConfiguration.json(Which can be created from this application).
- one or more results file in a
- Optionally, select an problem library to use (MIPLIB or MINLPLib).
- Once you have selected a file or files, click on upload.
- Click on the View All Results/View Plot button to get a table or plot with the benchmark results, depending on the currently active page.
- The following plots are available:
- Performance Profile (Absolute and relative)
- Solver Time per Solver
- Solver Time per Instance
- Number of Nodes
- Number of Iterations
- Termination Status
- Solution Quality
- Solution Time
- Compare a pair of solvers via the "Compare Solvers" page. Direct comparison on how many instances the solver time was better, worse or equal.
1.1 General Button Functionality
- Save Data - Stores the currently uploaded data to local storage, if the filtering has been applied on the table page, then that currently visible table will be stored.
- Download Saved Data - Download the user configuration (
UserConfiguration.json). - Download Data - Customize the downloadable user configuration file.
- Delete Data - Delete current table configuration from local storage.
1.2 Table Page Button Functionality
View Table - View the table of the uploaded results.
Show Slected Rows - View rows that have been selected from the table.
Clear Data Table - Clear current table.
Show Selected Rows - Filters the table and only shows selected problems.
Clear Data Table - Clears the currently visible table.
Settings
- Show n rows - The number of rows to show in the table.
- Column Visibility - Select which columns to show or hide.
Advanced Search - Create custom search queries.
Toggle Filters - Show filters for each column.
Export - Export the table as a CSV, copy table content to clipboard, or view it in the browsers print option.
1.3 Plot Pages Buttons Functionality
- View X - View the page specific plot.
- Download Chart Data - Download the chart data.
1.4 Compare Solvers Page Buttons Functionality
- Compare Solvers - Show the comparison table between two solvers.
2. Supported Formats
2.1 .trc
The following header structure and order should be used in conjunction with .trc files, if no header is provided in the result files:
InputFileName
ModelType
SolverName
NLP
MIP
JulianDate
Direction
NumberOfEquations
NumberOfVariables
NumberOfDiscreteVariables
NumberOfNonZeros
NumberOfNonlinearNonZeros
OptionFile
ModelStatus
TermStatus
ObjectiveValue
ObjectiveValueEstimate
SolverTime
NumberOfIterations
NumberOfDomainViolations
NumberOfNodes
UserComment
For further information, see https://gams.com/latest/docs/UG_SolverUsage.html#UG_SolverUsage_TraceFile.
2.2 .json
The file should include dataSet and dataFileType, defaultTime and gapLimit are optional.
{
"dataSet": [
"alan,MINLP,knitro,CONOPT,CPLEX,43365.479,min,8,9,4,24,3,1,8,Error,2.925,2.925,0.142,0,0,18,#,2.925,2.925,2.925,2.925,0,0,0,0,0",
"ball_mk2_10,MINLP,knitro,CONOPT,CPLEX,43365.479,min,2,11,10,21,10,1,8,Error,0,2.22044604925031E-16,2.5,0,0,3070,#,0,2.22044604925031e-16,0,2.22044604925031e-16,0,0,0,0,0",
"ball_mk2_30,MINLP,knitro,CONOPT,CPLEX,43365.479,min,2,31,30,61,30,1,2,Error,0,-26.887733399442,900.034,0,0,42269,#,0,-26.887733399442,0,-26.887733399442,Infinity,Infinity,0,0,0",
"ball_mk3_10,MINLP,knitro,CONOPT,CPLEX,43365.489,min,2,11,10,21,10,1,13,Error,0,NA,NA,NA,NA,NA,#,0,-Infinity,0,-Infinity,Infinity,Infinity,0,NaN,NaN",
"ball_mk4_05,MINLP,knitro,CONOPT,CPLEX,43365.51,min,2,11,10,21,10,1,13,Error,0,NA,NA,NA,NA,NA,#,0,-Infinity,0,-Infinity,Infinity,Infinity,0,NaN,NaN",
],
"dataFileType": "trc",
"defaultTime": 900,
"gapLimit": 0.1
}
As for now, this structure has to be used for the dataSet. It will eventually updated to a proper object.
3. Working with the Codebase
3.1 Prerequisites
Before getting started, make sure you have the following software installed on your machine:
Node.js: https://nodejs.org/
TypeScript: https://www.typescriptlang.org/
Webpack: https://webpack.js.org/
Install the required packages by running:
npm install
3.2 Bundling
Navigate to the project directory in your terminal and run:
npm run build
This runs the command "webpack --config webpack.config.js", which will build the application using webpack'. The created bundle.js and main.css are located in Dist/.
Dev server can be run with:
npnm run start
3.3 Other Scripts
Run unit tests using Jest:
npm run test:functions
Run UI tests with Playwright using Jest:
npm run test:ui
Lint the project files using ESLint:
npm run lint
To automatically fix linting issues:
npm run lint:fix
Generate documentation using TypeDoc:
npm run build:docs
Create a slimmed down release build using gulp:
npm run release
Create a slimmed down web release build using gulp:
npm run release:web